Aximsoft

Turning solar sensor data
into information teams can use

How we automated the preparation of high-volume sensor data for operational reporting, analysis, and energy forecasting.

By AximsoftAug. 2018

The challenge

The readings were there. Reliable reporting was harder.

A utility-scale solar operator depended on thousands of sensors to monitor site conditions, equipment performance, and energy generation.

Inconsistent file structures, processing conflicts, and manual aggregation made those readings difficult to turn into dependable information. The team needed to address three problems.

Operational visibility

Get timely information on generation, inverter performance, and possible anomalies.

Forecasting confidence

Provide consistent inputs for forecasts and analytical models.

Scalable processing

Handle more sensors and sites without adding the same amount of manual work.

The first priority was a dependable data pipeline that reporting and advanced analytics could build on.
What we built

A reliable path from sensor readings to usable datasets

We built automated pipelines to standardize sensor data, coordinate processing, and prepare datasets for reporting and forecasting. The work began with the quality and reliability of the underlying data.

Bring readings into a consistent format

Ingest data from field systems, retain original readings, and standardize timestamps and sensor identifiers.

Prepare the intervals teams need

Aggregate high-frequency readings into the required five-minute, fifteen-minute, hourly, or daily datasets.

Support day-to-day reporting

Prepare data for generation, expected versus actual output, inverter availability, and site performance reports.

Prepare inputs for forecasting

Supply curated datasets to forecasting, anomaly detection, and other analytical workflows.

Make the data easier to check

Add validation, quality monitoring, processing records, and metadata so teams can investigate issues.

How it works

From field readings to reporting and forecasting

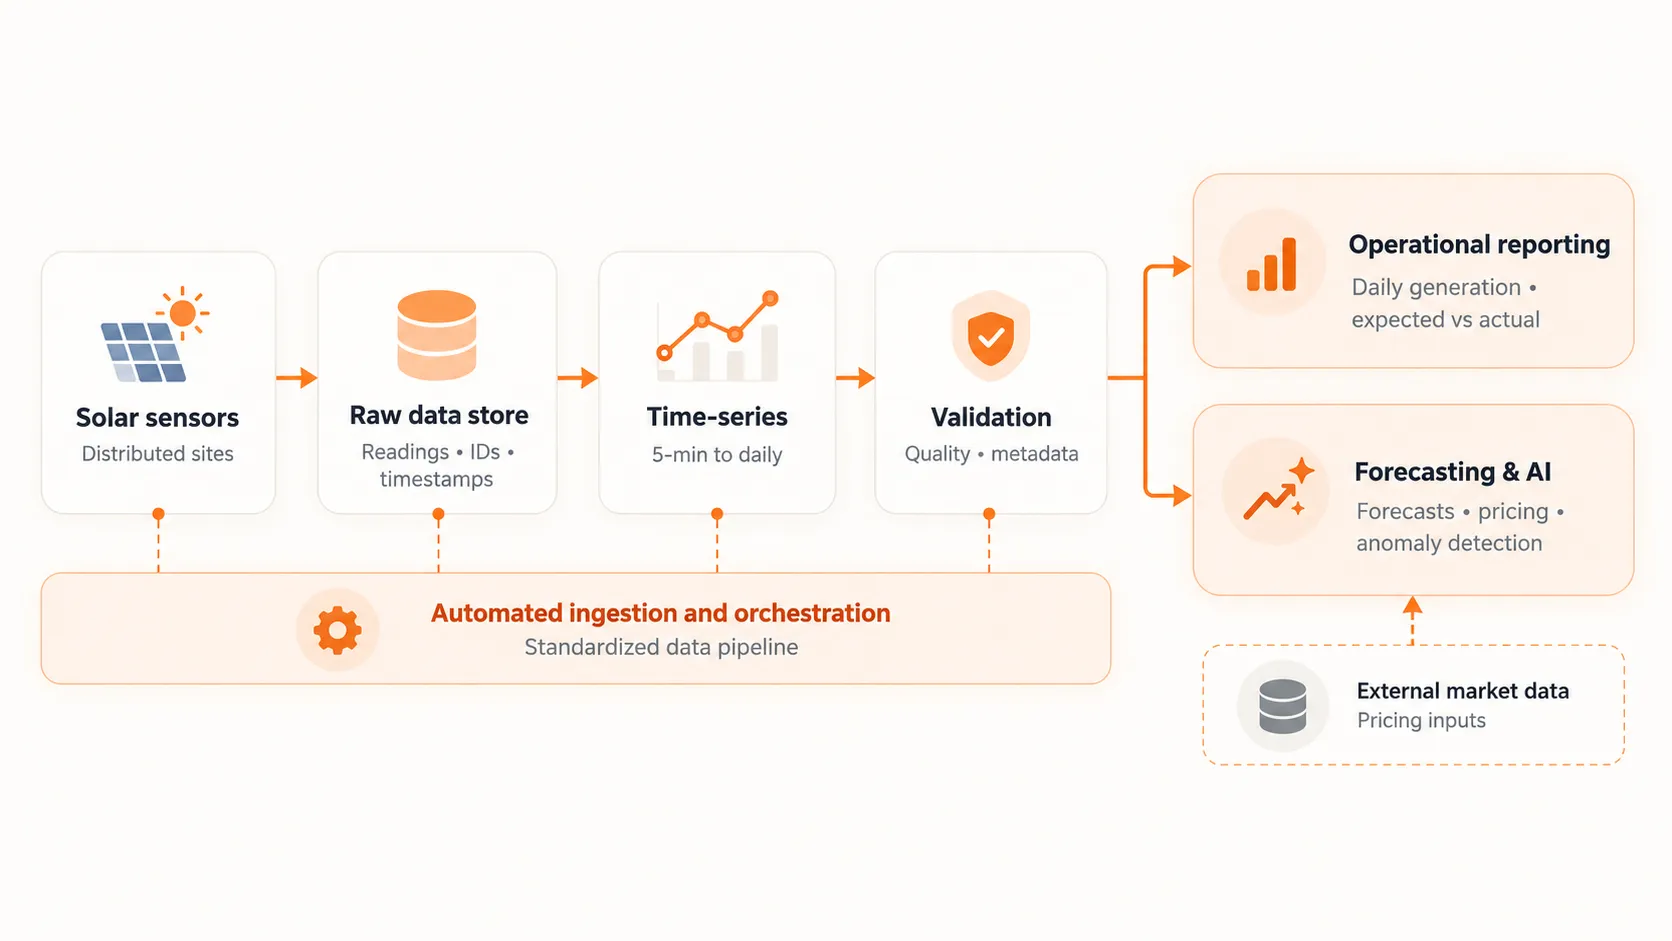
Six steps turn sensor readings into datasets that downstream teams can use.

Step 01

Ingest

Collect high-frequency readings from solar installations.

Step 02

Standardize

Preserve source data and align timestamps and identifiers.

Step 03

Validate and aggregate

Check readings and group them into the required time intervals.

Step 04

Deliver trusted data

Supply prepared datasets to reports and analytical systems.

Step 05

Support forecasting and AI.

Provide consistent inputs to the relevant models and workflows.

Step 06

Add market context

Bring in external market data where the analysis requires it.

Solar Data Pipeline Workflow & Processing Architecture Diagram

What changed for the team

Less preparation work and more consistent information

Automated processing gave the team a more dependable basis for operational reporting and analysis.

Less repetitive data preparation

Automated ingestion and transformation reduced reliance on manual file handling.

More consistent reports

Standardized datasets supported reporting on generation, equipment, and site operations.

Better inputs for forecasting

Curated time-series data supported forecasting and anomaly analysis.

A repeatable process across sites

The same approach could support additional sensors and locations.

More deliberate storage and processing

Aggregation and retention rules helped focus resources on the data needed for the work.

What we used

What we used to build it.

Automated ingestion and orchestration
IoT and time-series processing
Data standardization and validation
Time-based aggregation
Operational reporting and analytics
Data preparation for forecasting and AI
Quality monitoring and governance

The result

A data foundation the operation can build on

We helped replace fragmented preparation workflows with a more consistent, automated approach to sensor data.

The resulting datasets supported a clearer view of solar performance and provided a foundation for expanding reporting and forecasting as operations grew.